For problems where the target variable takes continuous values, regression is used. However, classification deals with a set of problems having target variables as discrete values i.e., some categories. There are various classification algorithms that deal with such problems. In this blog, we will discuss the basics of the classification problem.
Learning Outcomes
- Understand the basics of Classification
- Visualize elements of the Classification Problem
- Analyse the concepts of evaluation metrics
Classification is a supervised machine learning method that predicts the correct label of a given input data. In classification, training data is used to fully train the model, and then the test data is given as input to the model to evaluate the performance of the model on unseen data.
Let us consider the problem of predicting whether a patient’s tumor is benign or malignant. Since, the output will discrete value i.e., either benign or malignant, the given problem is classification. Given below is the dataset consisting of 5 features based on which prediction about patient’s tumor being benign or malignant is predicted.
| Radius | Texture | Area | Perimeter | Diagnosis |
| 16 | 20 | 710 | 108 | M |
| 28 | 14 | 696 | 96 | B |
| 14 | 20 | 536 | 88 | B |
| 13 | 23 | 768 | 135 | M |
| 25 | 32 | 567 | 128 | ? |
Here, as can be observed target variable (Diagnosis) has discrete values i.e., M or B. Each category in target variable is known as class. So, we have two classes ‘Benign’ and ‘Malignant’. The first four rows are given as input to the model for training. Once, the model is trained, test data which is the last row, in this case, is given as input to the model for generating prediction.
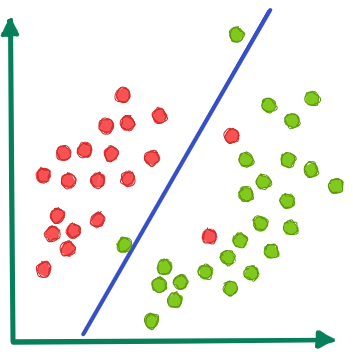
The below diagram gives a better description of the classification algorithm. Data points that are similar to each other represent one class.
| Class: Malignant |
| Class: Benign |
Methodology Followed by Classification Algorithm
Every row in the dataset is considered as an instance and every category is known as class. For every instance, probability is computed based on some mathematical functions.
Suppose, there are n classes in the dataset then the probability of an instance being in each class is computed using a mathematical function. The class with the highest probability is the designated class for given instance.
For example, probabilities computed for given instance are [0.3, 0.25, 0.45] with classes as [M, P, Q]. As Q class is used corresponding to highest probability, instance will be classified in class Q.
Evaluating Classification Model
There are two types of evaluation metrics that are used in regression i.e., error and accuracy metrics. For error, RSS evaluation metric is used to measure model prediction error over all examples in the training dataset. For accuracy, RMSE or R2 is used. However, some evaluation metric does not work for classification models. Following evaluation metrics are used in the classification model as listed below:
- Accuracy
- Precision
- Recall
- F1-score
- AUC-ROC
Details about all these metrics will be discussed in detail in an upcoming blog.
Takeaways
In this article following points were focused:
- Basic concepts of classification have been explained.
- Visualization of the classification model has been covered.
- Evaluation metrics for computing errors have been briefly discussed.
Thanks for reading! Feel free to post your queries. I would be happy to help!!