Machine learning is divided into two major categories: Supervised and Unsupervised. In supervised machine learning, there are major two categories: Regression and Classification. Regression reveals the relationship between variables and drives the success of machine learning. In this blog, we will discuss about regression problem.
Learning Outcomes
- Understand basics of Regression
- Visualize elements of Regression Problem
- Analyse the concepts of linear regression
- Understand polynomial regression
Regression analysis is a statistical method to model the relationship between independent and dependent variable. Informally, it helps understand how the value of dependent variable is changing with varying values of independent variables.
Let us understand this with the help of an example,
Suppose, we want to predict the cost incurred for a customer of a health insurance. The smoking health, age, and weight are known factors to us based on which health cost is computed as shown in table below:
Table 1: Health Data
| Age | Weight | Smoker | Health Cost Incurred (in thousands) |
| 34 | 62 | 1 | 45 |
| 56 | 74 | 0 | 67 |
| 23 | 60 | 1 | 32 |
| 35 | 67 | 0 | 88 |
| 29 | 52 | 1 | 76 |
| 43 | 55 | 1 | ? |
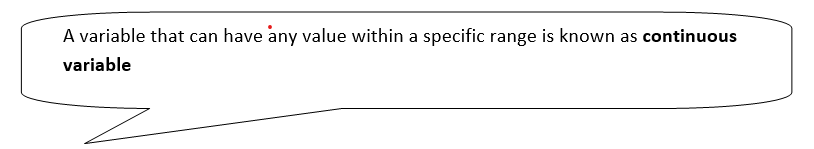
First five rows in the above table show the cost incurred on health provided age, weight, and smoking habit. The task is to predict or estimate the cost on health for the fifth instance. Here, the output variable i.e., health cost incurred can have any value in the range 0 to some high number and is known as continuous variable.
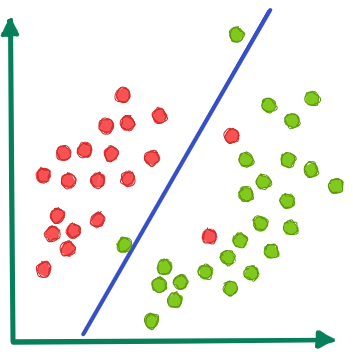
Any prediction problem where output variable is continuous comes under regression. Problems having discrete values (0/1) for the output variable are known as classification problem.
Elements of Regression Problem
- Target/ Dependent Variable
The variable that is predicted is known as target or dependent variable. For instance, in Table 1, health cost incurred is the dependent variable, often denoted by variable .
- Feature/ Independent Variables
Variables that are used to find the value of target variable are known as feature or independent variable. For instance- age, weight, and smoking health are independent variables, often represented by x1, x2, …, xn.
Regression Models
There are many models that can be used to solve regression problems. In this article, we will be discussing two regression models: linear regression and polynomial regression.
- Linear Regression
Dataset with one indepenedent variable is solved using linear regression model given below:
y = b0 + b1x1 (1)
Dataset with multiple independent variables is solved using linear regression model given below:
y = b0 + b1x1 + b2x2 + … + bnxn (2)
In equation (1) and equation (2), value of variable is generated by the model and is therefore known as predicted value.
b0 : bias parameter
b1,b2,b3…,bn : coefficients which are constant in nature
Building a Model
Using the data in Table 1, let us find the predicted value for the first five data instances. Since we have three independent variables, age, weight, smoker, linear regression model would be :
y = b0 + b1x1 + b2x2 +b3x3
where,
x1: age x2 : weight x3 : smoker
By using some mathematical process, let us assume that we obtain the values of model parameter and model looks like:
y = -10 + 1 * x1 + 2 * x2 + 1 * x3
The predicted values for first five instances using above model is shown in Table 2. It can be observed that predicted value might be close to actual values but not same.
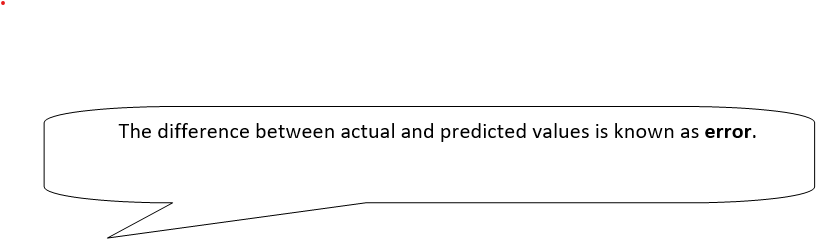
Table 2: Prediction using Regression Model
| Age | Weight | Smoker | Predicted Health Cost (in thousands) | Health Cost Incurred (in thousands) |
| 34 | 62 | 1 | 149 | 45 |
| 56 | 74 | 0 | 194 | 67 |
| 23 | 60 | 1 | 134 | 32 |
| 35 | 67 | 0 | 149 | 88 |
| 29 | 52 | 1 | 124 | 76 |
Visual representation
Let us explore visual representation of linear regression model.
For simplicity we are building a linear regression model using only one independent variable on the given below dataset.
Table 3: Dataset for Visualization
| x | Y |
| 0.300873 | 2.253513 |
| 0.186946 | 1.878124 |
| 0.323183 | 2.214512 |
| 0.566971 | 2.910902 |
| 0.398254 | 2.646285 |
A scatter plot for Table 3 is as follows.
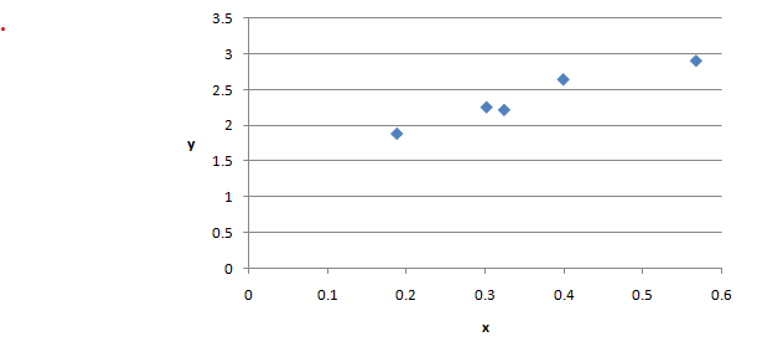
Figure 1 : Scatter Plot
In linear regression, motive is to find a straight line that will be best fit for the data. Best fit means a line that passes through maximum number of data points. This line will be used for finding the values for variable y given independent variable x.
Considering three lines in below figure,
A = 1.5 +2*x (Blue line)
B = 1.6 +2.2*x (Red Line)
C = 1.6 +2.4*x (Black Line)
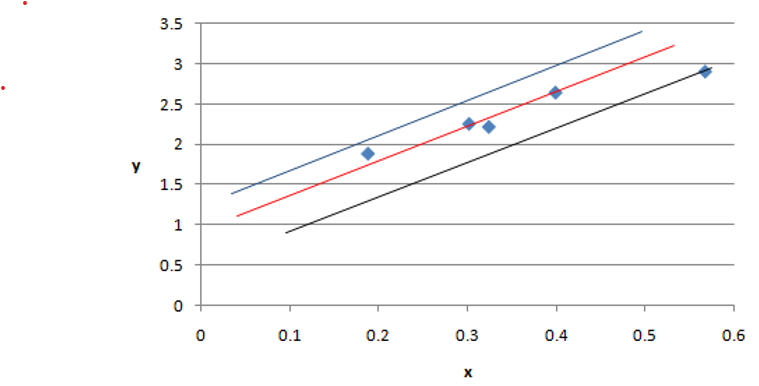
Figure 2: Three linear regression models for data in Table 3
From figure 2, it can be noted that B = 1.6 + 2.2*x is the best regression model among three for given dataset and thus the “line of best fit”.
Model Errors
There is high possibility of variations between predicted and actual values leading to error. Therefore, we need to measure the errors associated with the model. The objective is to build a regression model with minimum errors.
There are various evaluation metrics used to compute errors. We will discuss Root Mean Squared Error (RMSE) and Mean Squared Error (MSE) in this article.
RMSE is given by:

where,
is the predicted value,
is the actual value,
is number of data points.
MAE is given by:

Similarly, we can compute errors using other evaluation metrics.
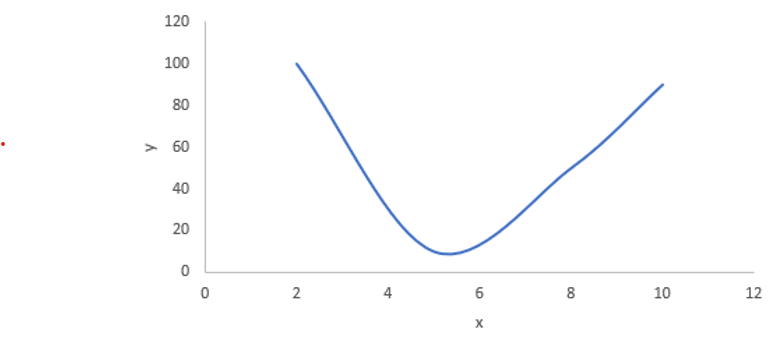
- Polynomial Regression
At times, there is no linear relationship between independent and dependent variables. In such cases, polynomial regression comes into picture. The relationship between independent and dependent variable is modelled using nth degree polynomial.
Error computation is similar to linear regression model.
Below is an example of polynomial regression.
Implemenation of linear and polynomial regression will be discussed in upcoming blogs.
Takeaways
In this article following points were focused:
- Basic concepts of linear regression has been explained.
- Two regression models that led to success of machine learning.
- Visaulization of regression model has been covered.
- Computation of errors has been briefly discussed.
Thanks for reading! Feel free to post your queries. I would be happy to help!!